Search job, employer or placeSearch cards/Check an Offer
EmployerNo.E-00097

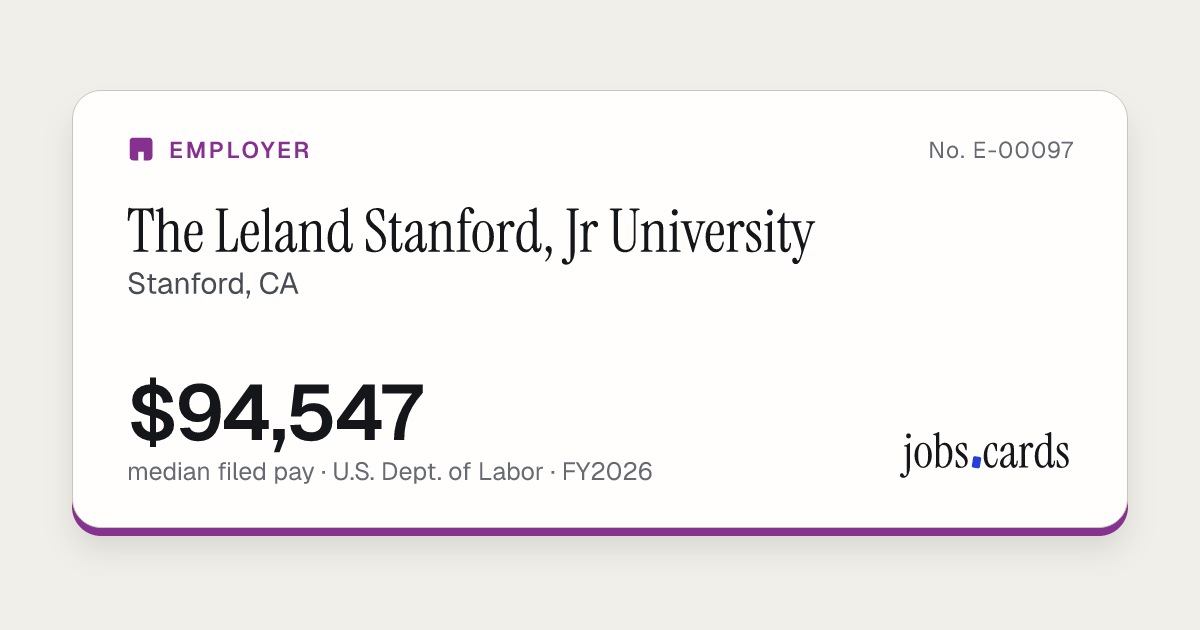
The Leland Stanford, Jr University

Stanford, CANAICS 611310

Has filed before
$94,547median filed pay, all roles

Spread of filed pay, 10th to 90th percentile

436filings certified, FY2026

Certified filings by wage level, FY2026

For new employment
220
For continued employment
127
Most-filed role
Biological Scientists, All Other
Most-filed work state
CA · 429
Visa classes, 436 certified filings
H-1B 428 · E-3 Australian 8
Source: U.S. Department of Labor filing records, FY2026 · checked Nov 16, 2026
SourcesNo.E-00097

Where This Card Comes From

Median filed pay is the middle value of the wages this employer wrote on its certified, full-time filings. Filings cover positions offered to foreign workers, base pay only. Past filings are history, not a promise. We match filings to this employer by its registered name; near-duplicate spellings are merged by rule. Subsidiaries keep their own cards.

USCIS file for fiscal year 2023: 254 approvals, 2 denials. This file is old and may be partial.

Content hash 6ed1a274 · first dealt Nov 16, 2026 · last changed Nov 16, 2026
Save as Image Compare

jobs.cards/c/E-00097

Has The Leland Stanford, Jr University Filed for Foreign Workers?

It has. The Leland Stanford, Jr University had 436 filings certified by the U.S. Department of Labor in fiscal year 2026. Its median filed pay was $94,547 a year, base pay only. Past filings show what an employer has done; they don't promise it will sponsor a new hire.

Checked Nov 16, 2026Source: U.S. Department of LaborNot legal or immigration advice

USCIS file for fiscal year 2023: 254 approvals, 2 denials. This file is old and may be partial.

What the Filings Show

Worked out from this employer's FY2026 filing records. Past filings are history, not a promise.

  • The Leland Stanford, Jr University filed 463 labor condition applications decided in FY2026. 436 were certified, 27 were withdrawn and 0 were denied.
  • The most common wage level on its certified filings was Level I: 232 of the 436 filings that state a level (53%). Levels I and II together make up 83%.
  • The middle half of its filed pay runs from $81,027 to $134,123 a year, around a median of $94,547. A tenth of filings state $77,507 or less, and a tenth $179,608 or more.
  • By purpose: 220 for new employment, 127 to continue a current worker's employment, 27 for a worker changing employer, 14 amending an earlier petition. One filing can serve more than one purpose, and some state none.
  • Its most-filed role, Biological Scientists, All Other, accounts for 118 of its 436 certified filings (27%).
  • 98% of its certified filings (429) are for work in CA.

Filed Pay by Role

Certified filings in FY2026, by government job title. Each row with enough filings links to its own filed-pay card.

Job Titles on the Filings

The titles this employer wrote most often, with the middle half of filed pay where there are 10 or more filings.

Job TitleFilingsMedian Filed PayMiddle Half
Postdoctoral Research Affiliate105$79,802$77,432 – $81,053
Basic Life Research Scientist72$84,000$82,000 – $90,073
Instructor24$92,450$85,000 – $101,000
Physical Science Research Scientist19$96,000$93,500 – $107,765
Clinical Assistant Professor17$214,000$180,000 – $295,000
Assistant Professor15$199,000$143,809 – $271,846
Research Engineer9$118,000—
Software Developer 39$175,560—
Staff Engineer 29$130,000—
Life Science Research Professional 18$71,739—

Where the Work Is

Embed This Card

Paste this where you want the card to appear. It stays up to date.