Search job, employer or placeSearch cards/Check an Offer
SalaryNo.S-51899

Financial and Investment Analysts

Ann Arbor, MIGovernment job code 13-2051

Market pay · all workers · BLS, May 2025

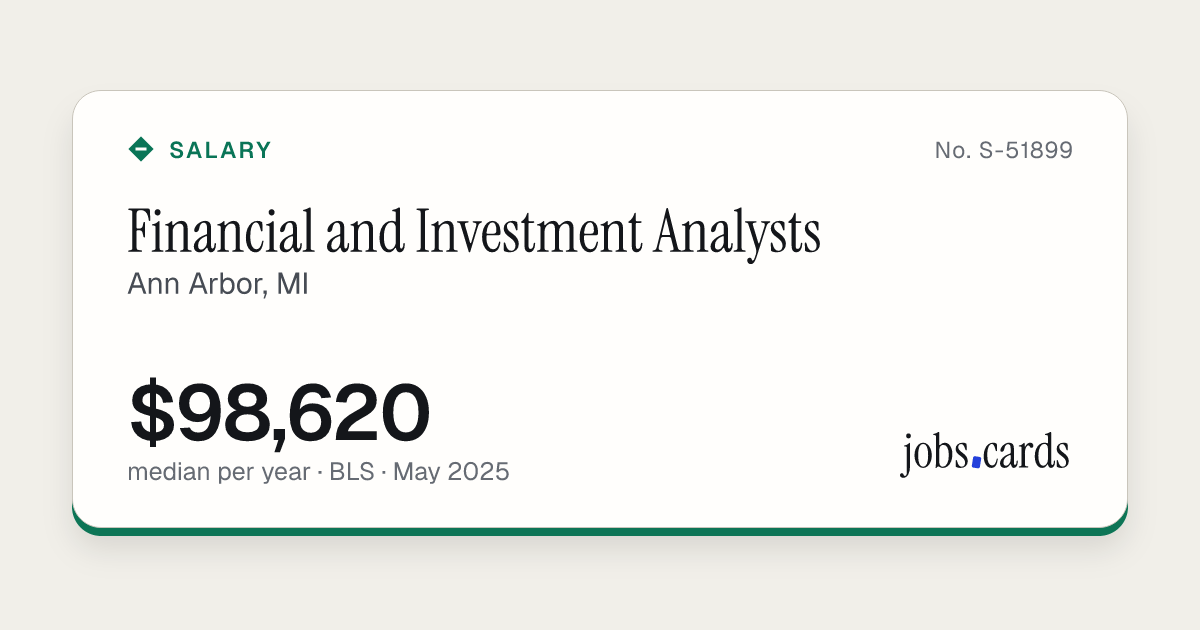
$98,620median pay per year · $47.42 an hour
10th
$70,730
25th
$80,840
Median
$98,620
75th
$107,830
90th
$128,280

Government wage levels · wage year 2026-27

Level I
$73,299
Level II
$87,610
Level III
$101,920
Level IV
$116,230

The four pay levels the Department of Labor sets for this job in Ann Arbor, MI. Yearly figures are the hourly level times 2,080 hours.

Filed pay

Fewer than 10 certified full-time filings for this job here, so there is no filed-pay figure.

People in this job here
340
Against the U.S. median
−4%
Mean pay per year
$102,060
Source: U.S. Bureau of Labor Statistics, May 2025 data · checked Nov 16, 2026
SourcesNo.S-51899

Where This Card Comes From

We show the government's numbers as published. Yearly pay is the hourly figure times 2,080 hours. Nothing is modelled or guessed. The U.S. comparison uses the national median for the same job code.

This page includes information from the O*NET 31.0 Database by the U.S. Department of Labor, Employment and Training Administration (USDOL/ETA). Used under the CC BY 4.0 license. O*NET® is a trademark of USDOL/ETA.

Content hash 20d68385 · first dealt Nov 16, 2026 · last changed Nov 16, 2026
Save as Image Compare

jobs.cards/c/S-51899

What Does This Job Pay in Ann Arbor, MI?

Financial and Investment Analysts in Ann Arbor, MI earn a median of $98,620 a year, according to the U.S. Bureau of Labor Statistics survey for May 2025. Half earn between $80,840 and $107,830. The lowest-paid tenth earn under $70,730 and the highest-paid tenth earn over $128,280. These are government survey figures, not estimates from ads.

Checked Nov 16, 2026Source: U.S. Bureau of Labor Statistics

Reading the Numbers

Worked out from the published figures on this card. Nothing here is an estimate.

  • The median here is 4% below the national median of $102,740 for the same job.
  • It is 3% above the Michigan median of $95,420.
  • 340 people hold this job here, less than 0.1% of the 361,980 who hold it across the country.
  • Of every 1,000 jobs here, 1.56 are this job, which makes it 33% less common here than in the U.S. as a whole.
  • The middle half of workers earn between $80,840 and $107,830, a band $26,990 wide.
  • Pay at the 90th percentile ($128,280) is 1.8 times pay at the 10th ($70,730).
  • The average (mean) is $102,060, 3% above the median. An average above the median means a smaller group of high earners pulls it up.
  • By the hour, the published median is $47.42.
  • The market median of $98,620 meets government wage Level II for this job and area (wage year 2026-27).

What Financial and Investment Analysts Do

Conduct quantitative analyses of information involving investment programs or financial data of public or private institutions, including valuation of businesses.

Common job titles: Analyst, Credit Products Officer, Equity Research Analyst, Financial Analyst, Investment Analyst, Planning Analyst, Portfolio Manager, Real Estate Analyst, Securities Analyst, Trust Officer.

Preparation This Job Usually Needs

Job Zone Four: Considerable Preparation Needed. Most of these occupations require a four-year bachelor's degree, but some do not. Employees in these occupations usually need several years of work-related experience, on-the-job training, and/or vocational training. A considerable amount of work-related skill, knowledge, or experience is needed for these occupations. For example, an accountant must complete four years of college and work for several years in accounting to be considered qualified.

This page includes information from the O*NET 31.0 Database by the U.S. Department of Labor, Employment and Training Administration (USDOL/ETA). Used under the CC BY 4.0 license. O*NET® is a trademark of USDOL/ETA.

Embed This Card

Paste this where you want the card to appear. It stays up to date.