Search job, employer or placeSearch cards/Check an Offer
SalaryNo.S-156180

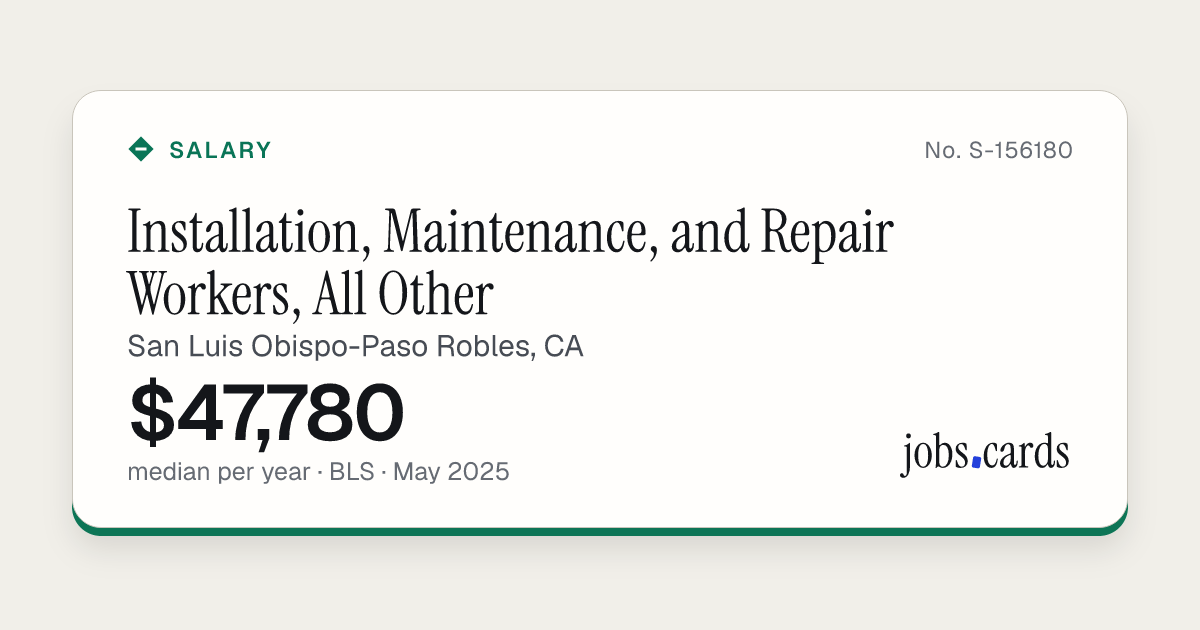
Installation, Maintenance, and Repair Workers, All Other

San Luis Obispo-Paso Robles, CAGovernment job code 49-9099

Market pay · all workers · BLS, May 2025

$47,780median pay per year · $22.97 an hour
10th
$37,110
25th
$39,500
Median
$47,780
75th
$60,760
90th
$72,290

Small sample: BLS marks this estimate as less reliable, so treat the figures with care.

Government wage levels · wage year 2026-27

Level I
$38,147
Level II
$45,427
Level III
$52,728
Level IV
$60,008

The four pay levels the Department of Labor sets for this job in San Luis Obispo-Paso Robles, CA. Yearly figures are the hourly level times 2,080 hours.

Filed pay

Fewer than 10 certified full-time filings for this job here, so there is no filed-pay figure.

People in this job here
150
Against the U.S. median
−3%
Mean pay per year
$52,790
Source: U.S. Bureau of Labor Statistics, May 2025 data · checked Nov 16, 2026
SourcesNo.S-156180

Where This Card Comes From

We show the government's numbers as published. Yearly pay is the hourly figure times 2,080 hours. Nothing is modelled or guessed. The U.S. comparison uses the national median for the same job code.

This page includes information from the O*NET 31.0 Database by the U.S. Department of Labor, Employment and Training Administration (USDOL/ETA). Used under the CC BY 4.0 license. O*NET® is a trademark of USDOL/ETA.

Content hash a713d583 · first dealt Nov 16, 2026 · last changed Nov 16, 2026
Save as Image Compare

jobs.cards/c/S-156180

What Does This Job Pay in San Luis Obispo-Paso Robles, CA?

Installation, Maintenance, and Repair Workers, All Other in San Luis Obispo-Paso Robles, CA earn a median of $47,780 a year, according to the U.S. Bureau of Labor Statistics survey for May 2025. Half earn between $39,500 and $60,760. The lowest-paid tenth earn under $37,110 and the highest-paid tenth earn over $72,290. These are government survey figures, not estimates from ads.

Checked Nov 16, 2026Source: U.S. Bureau of Labor Statistics

Reading the Numbers

Worked out from the published figures on this card. Nothing here is an estimate.

  • The median here is 3% below the national median of $49,230 for the same job.
  • It is 7% below the California median of $51,230.
  • 150 people hold this job here, less than 0.1% of the 176,300 who hold it across the country.
  • Of every 1,000 jobs here, 1.26 are this job, which makes it 12% more common here than in the U.S. as a whole.
  • The middle half of workers earn between $39,500 and $60,760, a band $21,260 wide.
  • Pay at the 90th percentile ($72,290) is 1.9 times pay at the 10th ($37,110).
  • The average (mean) is $52,790, 10% above the median. An average above the median means a smaller group of high earners pulls it up.
  • By the hour, the published median is $22.97.
  • The market median of $47,780 meets government wage Level II for this job and area (wage year 2026-27).

California requires pay or a pay range in job ads from covered employers. What California’s rule says

What Installation, Maintenance, and Repair Workers, All Other Do

All installation, maintenance, and repair workers not listed separately.

Preparation This Job Usually Needs

Job Zone 1-2: Very Little to Some Preparation Needed. Usually requires a high school diploma or GED, though some occupations may not. Ranges from a few days to one year of on-the-job training. Some occupations may need little or no previous experience; others require several months to a year of experience. For example, landscaping and groundskeeping workers might require very little training or previous experience, while agricultural equipment operators can benefit from on-the job training.

This page includes information from the O*NET 31.0 Database by the U.S. Department of Labor, Employment and Training Administration (USDOL/ETA). Used under the CC BY 4.0 license. O*NET® is a trademark of USDOL/ETA.

Embed This Card

Paste this where you want the card to appear. It stays up to date.