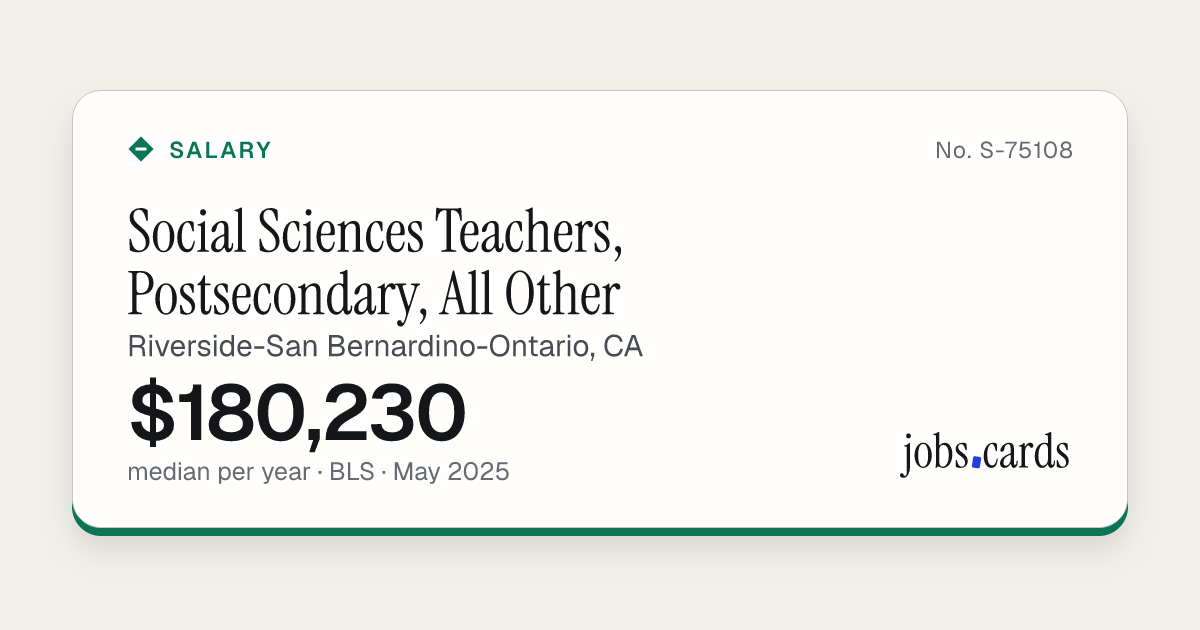
Social Sciences Teachers, Postsecondary, All Other
Riverside-San Bernardino-Ontario, CAGovernment job code 25-1069
Market pay · all workers · BLS, May 2025
- 10th
- $82,470
- 25th
- $149,250
- Median
- $180,230
- 75th
- $180,230
- 90th
- $205,670
Small sample: BLS marks this estimate as less reliable, so treat the figures with care.
BLS publishes yearly figures only for this job.
Government wage levels · wage year 2026-27
- Level I
- $223,974,400
- Level II
- $280,550,400
- Level III
- $337,126,400
- Level IV
- $393,702,400
The four pay levels the Department of Labor sets for this job in Riverside-San Bernardino-Ontario, CA. Yearly figures are the hourly level times 2,080 hours.
Filed pay
Fewer than 10 certified full-time filings for this job here, so there is no filed-pay figure.
- People in this job here
- 180
- Against the U.S. median
- +147%
- Mean pay per year
- $162,350
Where This Card Comes From
- Pay percentiles and people in this jobMay 2025 dataU.S. Bureau of Labor Statistics, Occupational Employment and Wage Statistics, metropolitan area table, SOC 25-1069
- Wage levelsWage year 2026-27U.S. Department of Labor, OFLC wage-level tables, Riverside-San Bernardino-Ontario, CA
- Job description and common titlesO*NET 31.0O*NET 31.0 Database, USDOL/ETA, CC BY 4.0
We show the government's numbers as published. Yearly pay is the hourly figure times 2,080 hours. Nothing is modelled or guessed. The U.S. comparison uses the national median for the same job code.
This page includes information from the O*NET 31.0 Database by the U.S. Department of Labor, Employment and Training Administration (USDOL/ETA). Used under the CC BY 4.0 license. O*NET® is a trademark of USDOL/ETA.
Content hash 7506355d · first dealt Nov 16, 2026 · last changed Nov 16, 2026